Since 2020, litter along America's roadways and waterways has fallen by more than a third. 35 billion pieces remain — and the study shows precisely where the next gains are, and where they are being lost.
What changed
Measured against 2020
34%
Overall decline
Roadways and waterways combined
45%
Waterway litter
Down more than twice as far as roadways
22%
Roadway litter
Down, but the slower half
62%
Cigarette butts
Outpacing the drop in smoking
96
Pieces per person
Down from 152 in 2020
35B
Pieces remaining
Progress, not mission accomplished
Source: Keep America Beautiful 2026 National Litter Study (kab.org/programs-impact/national-litter-study)
Keep America Beautiful 2026 National Litter Study
America Making Progress on Litter
Litter is down 34%, but 35 billion pieces still remain in our parks, waterways, and public spaces. And coastal litter is raising new concerns.
The 2026 Keep America Beautiful National Litter Study provides the most comprehensive picture to date of litter in the United States, and how it is changing over time.
By building on data collected in 2020, the Study offers a rare longitudinal view of trends in litter quantity, composition, and sources across the country. For the first time, the Study also includes a national estimate of litter along U.S. coastal areas, expanding our understanding of litter’s environmental impact.
Why This Study Matters
Video
Litter impacts every community in America. The 2026 National Litter Study helps us understand where progress is being made, where challenges remain, and how communities, businesses, and individuals can take action to create cleaner, greener, and more beautiful places.
Pieces Per Mile
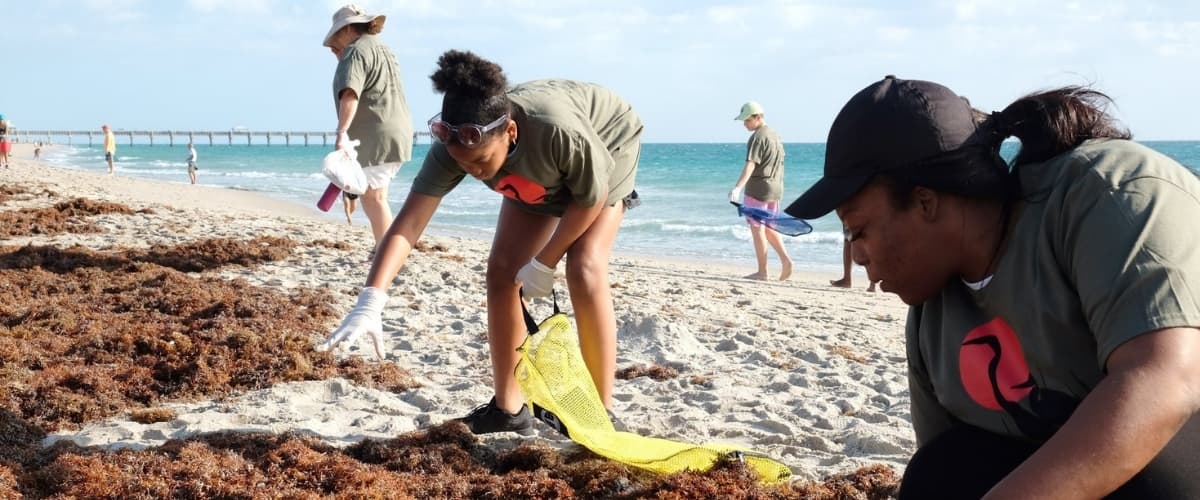
For the first time, the Study includes a national estimate of litter along coastal areas, revealing significantly higher concentrations of litter in some of America’s most environmentally sensitive spaces.
16,800
Coastal Areas
2,200
Roadways
1,300
Waterways
The Good News
From 2020 to 2025, litter along America’s roadways and surface waterways declined by 34%.
The Challenge Ahead
While litter is down, but the problem is far from solved. There are still
35 billion pieces of litter
across America’s roadways, waterways, and coastal areas.
Hover to See the Impact!
Tap to See the Impact!
Real progress is happening. Compare 2025 findings with 2020 data to see how litter levels have changed across America’s roadways, waterways, and public spaces.
Litter Per Capita
along roadways and waterways
96
2025
152
2020
pieces per person
Roadway Litter
in America is down
2,204
2025
2,857
2020
items per mile
A 22% reduction!
Surface Waterways Litter
decreased in our rivers, streams, and lakes
1,300
2025
2,411
2020
items per mile
A 45% reduction!
Yes, We’re Making Progress.
But America still has a big litter problem. Download the Study to see what’s working, where the biggest gaps remain, and how your community can take action.
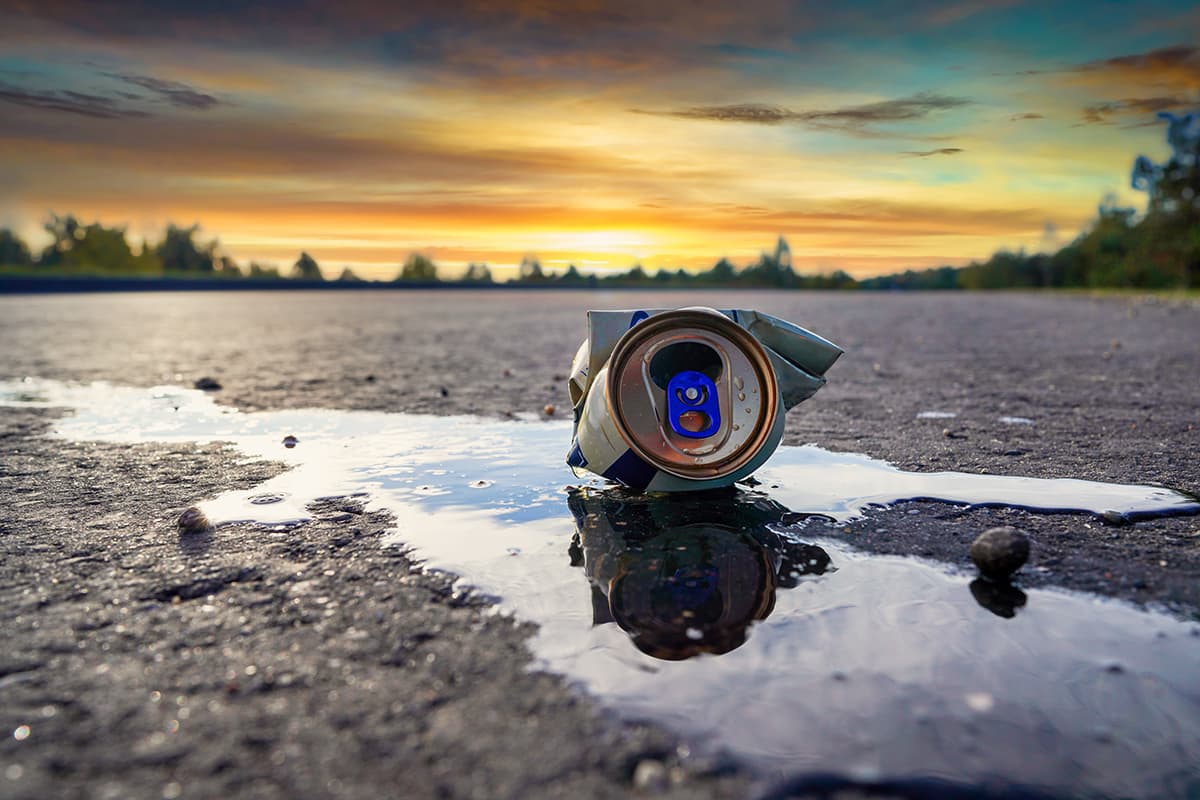
Americans Don’t Like Litter.
Across geography, age, and political affiliation, Americans overwhelmingly agree that litter is a problem in the U.S. and that we all have a role to play in creating cleaner communities.
94
Of Americans say litter is a problem.
90
Say reducing litter is a personal responsibility.
76
Say litter is a problem in their own community.
What Americans think
Nobody is arguing about this
Across geography, age and political affiliation, agreement on litter is close to unanimous — which is rare enough to be worth acting on.
94%
Say litter is a problem
Nationally
90%
Call it personal responsibility
Their own, not someone else's
31%
Recall prevention messaging
The gap worth closing
Source: Keep America Beautiful 2026 National Litter Study (kab.org)
Litter Trends
Litter Is Down Across Most Categories
Litter tells us a lot about how we live today — what we use, what we throw away, and where better solutions are needed. The decline in cigarette butt litter outpaced the decrease in smoking.
24%
Plastic
Down
34%
Glass
Down
77%
Organics
Down
45%
Paper
Down
30%
Metal
Down
62%
Cigarette butts
Down
New Areas of Concern
Some types of litter increased, reflecting changing consumer habits.
36%
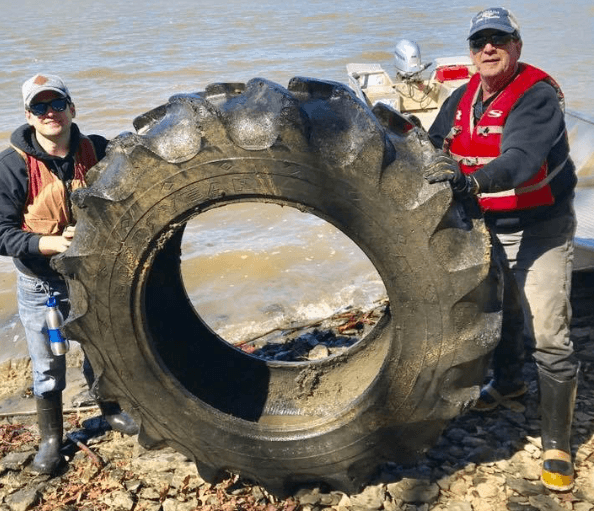
Litter from tires, tire treads, and vehicle debris
Up
50%
Cardboard litter
Up
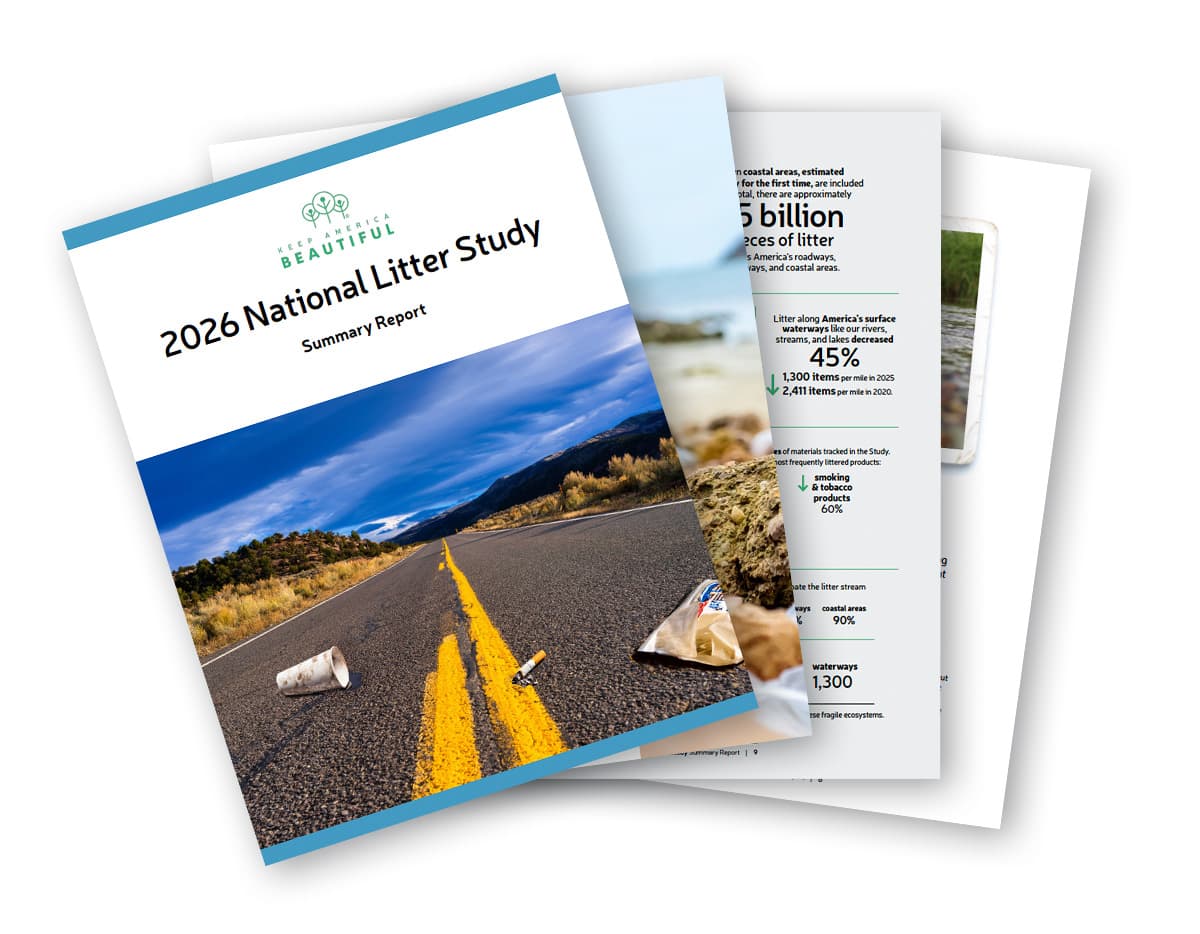
Download the 2026 Litter Study
Just fill out the form to get your PDF copy of the Litter Study.
Form not loading? Open it in a new tab (opens in a new tab).
New this year
The coastline is the outlier
Coastal litter was estimated nationally for the first time in 2026, and it changes the picture. Coastal zones carry 8 to 13 times more litter per mile than inland roadways and waterways.
The categories are shifting too, and they track how people actually live. Cardboard litter is up 50% as online shopping reshapes household habits. Plastic water bottle litter rose 20%. PPE litter — the masks and gloves that surged during the pandemic — has fallen 76%.
Litter tells the story of how we live. Right now, it's telling a story of progress — but it's also showing us exactly where we need to focus next.
David Scott, PhD — SVP of Research and Data, Keep America Beautiful
Acknowledgments
The Keep America Beautiful National Litter Study was made possible by the donations and support of many individual Americans and the following organizations who are Keep America Beautiful partners in ending litter: